How Can the Pharma Industry Better Calculate Their Carbon Footprint? | Saving the Planet One Site Visit at a Time
How an intentional carbon reduction tool is calculating the impact of clinical research associates’ travel.
In the 1960s two scientists at the National Oceanic and Atmospheric Administration (NOAA) made the connection between increasing carbon dioxide (greenhouse gases) in the atmosphere and rising Earth temperatures. Six decades later, climate change brought about by human civilization is now an urgent focus of activists and scientists around the world. Recognizing our own responsibility to reduce the impact of our business operations on the environment, we at Syneos Health have made protecting the planet one of the four pillars of our Environmental, Social and Governance Strategy.
We’ve aligned our environmental goals with global initiatives – most notably by being a signatory to The Climate Pledge (along with nearly 5,000 global organizations) to reach net-zero carbon by 2040, which will be 10 years ahead of the Paris Agreement. We’ve also committed to near-term, company-wide emission reduction goals through the Science-Based Targets initiative (SBTi). Targets are considered ‘science-based’ if they are in line with what the latest climate science deems necessary to meet the goals of the Paris Agreement – limiting warming to 1.5°C. We are motivated by the power of science, and are working hard to align our environmental goals and reporting with globally recognized practices.
Our environmental strategy is broad based, incorporating energy conservation, waste management, green construction, fleet energy consumption, and our supply chain. Further, we’re keen on assessing and reducing the potential sources of carbon dioxide-intensive activities in clinical trials. As a first step, we’ve launched a pilot program to raise awareness of the impact of travel by Clinical Research Associates (CRAs) on carbon emissions. To support this effort, we’ve created a proprietary tool to measure carbon emissions and meet our reduction goals. We firmly believe that “knowledge is power” and the more we understand something, the better able we are to address it. This pilot program is a first step toward being able to take meaningful action.
As we embark on our decarbonization journey, we’re eager to collaborate with sponsors in adopting innovative strategies for reducing the carbon footprint of our CRAs providing functional services.
What Impact Do Clinical Trials Have on the Environment?
Traditional clinical trials involve a number of activities that are potentially carbon dioxide intensive. These sources include:
- Patients: Patient travel to and from clinical sites as well as the consumables they use during participation
- Sites and Investigators: Sites’ protocol execution, facilities overhead, and waste disposal
- Sponsors: Sponsors’ trial-related travel (including validation and monitoring visits and site training) as well as their documentation distribution and data storage and their approach to clinical development planning (single study versus multiple studies)
- Third-Party Suppliers: Activities of third-party suppliers, such as the provision and disposal of supplies, the processing and storage of biosamples by central labs, and vendors’ data storage
We might logically assume that when trials are decentralized, the environmental impact of some of these activities are lessened or even eliminated. Yet, the Pistoia Alliance, a global, non-profit organization of life science companies who collaborate to advance various R&D initiatives, notes that no data exists to demonstrate exactly to what degree Decentralized Clinical Trial (DCT) models positively affect the carbon footprint/sustainability of clinical trials. The Alliance calls for “a robust and accurate methodology” to make the assessment.
Accordingly, the Alliance has launched the Clinical Trials Environmental Community of Interest (Col), and we at Syneos Health are leading the group’s efforts to create a dynamic model that will measure and compare the carbon footprint of traditional, centralized, site-based trials with that of decentralized clinical trials. Users of the model will have the ability to run “what if” scenarios to see how various trial parameters would impact its carbon footprint.
Our Pilot Program to Monitor the Carbon Footprint of CRAs
Knowing that many of our customers share our interest in finding ways to reduce the carbon footprint of clinical trials, we launched a pilot program using proprietary technology – an Intentional Carbon Reduction (ICR) tool. The tool calculates the direct carbon footprint of CRA travel.
We’ve launched a pilot program with one of our large pharma FSP partners in which 50 CRAs across Germany, UK, and France are using their travel-booking tool and visit schedules to input their mode of travel and travel distance into the ICR tool. Their records allow us to establish a baseline measurement of carbon emissions.
We’re continuing to monitor CRA travel through monthly reports in order to compare our carbon footprint to the baseline. CRAs receive a monthly score based on their carbon footprint, which gives them information they can use to make their own decisions to reduce their individual carbon footprint. The data generated by the ICR tool is spurring discussions and brainstorming sessions, giving us insights to identify areas of deviation and rapidly realign resources.
Ongoing monitoring will make deep operational details available, providing insight into both expected and actual CRA activity. Once we understand the current carbon footprint of these CRAs, we can look for efficiencies and formulate an improvement plan that will balance the twin goals of supporting trial execution while reducing our carbon footprint. We can make data-driven and common-sense decisions to adjust CRA routes, travel modes, etc. For instance, we’ve already noticed that most CRAs in the pilot were traveling by car, alone. We’ve, therefore, started to explore the feasibility of ridesharing or travel via public transportation.
The Intentional Carbon Reduction (ICR) Tool up Close
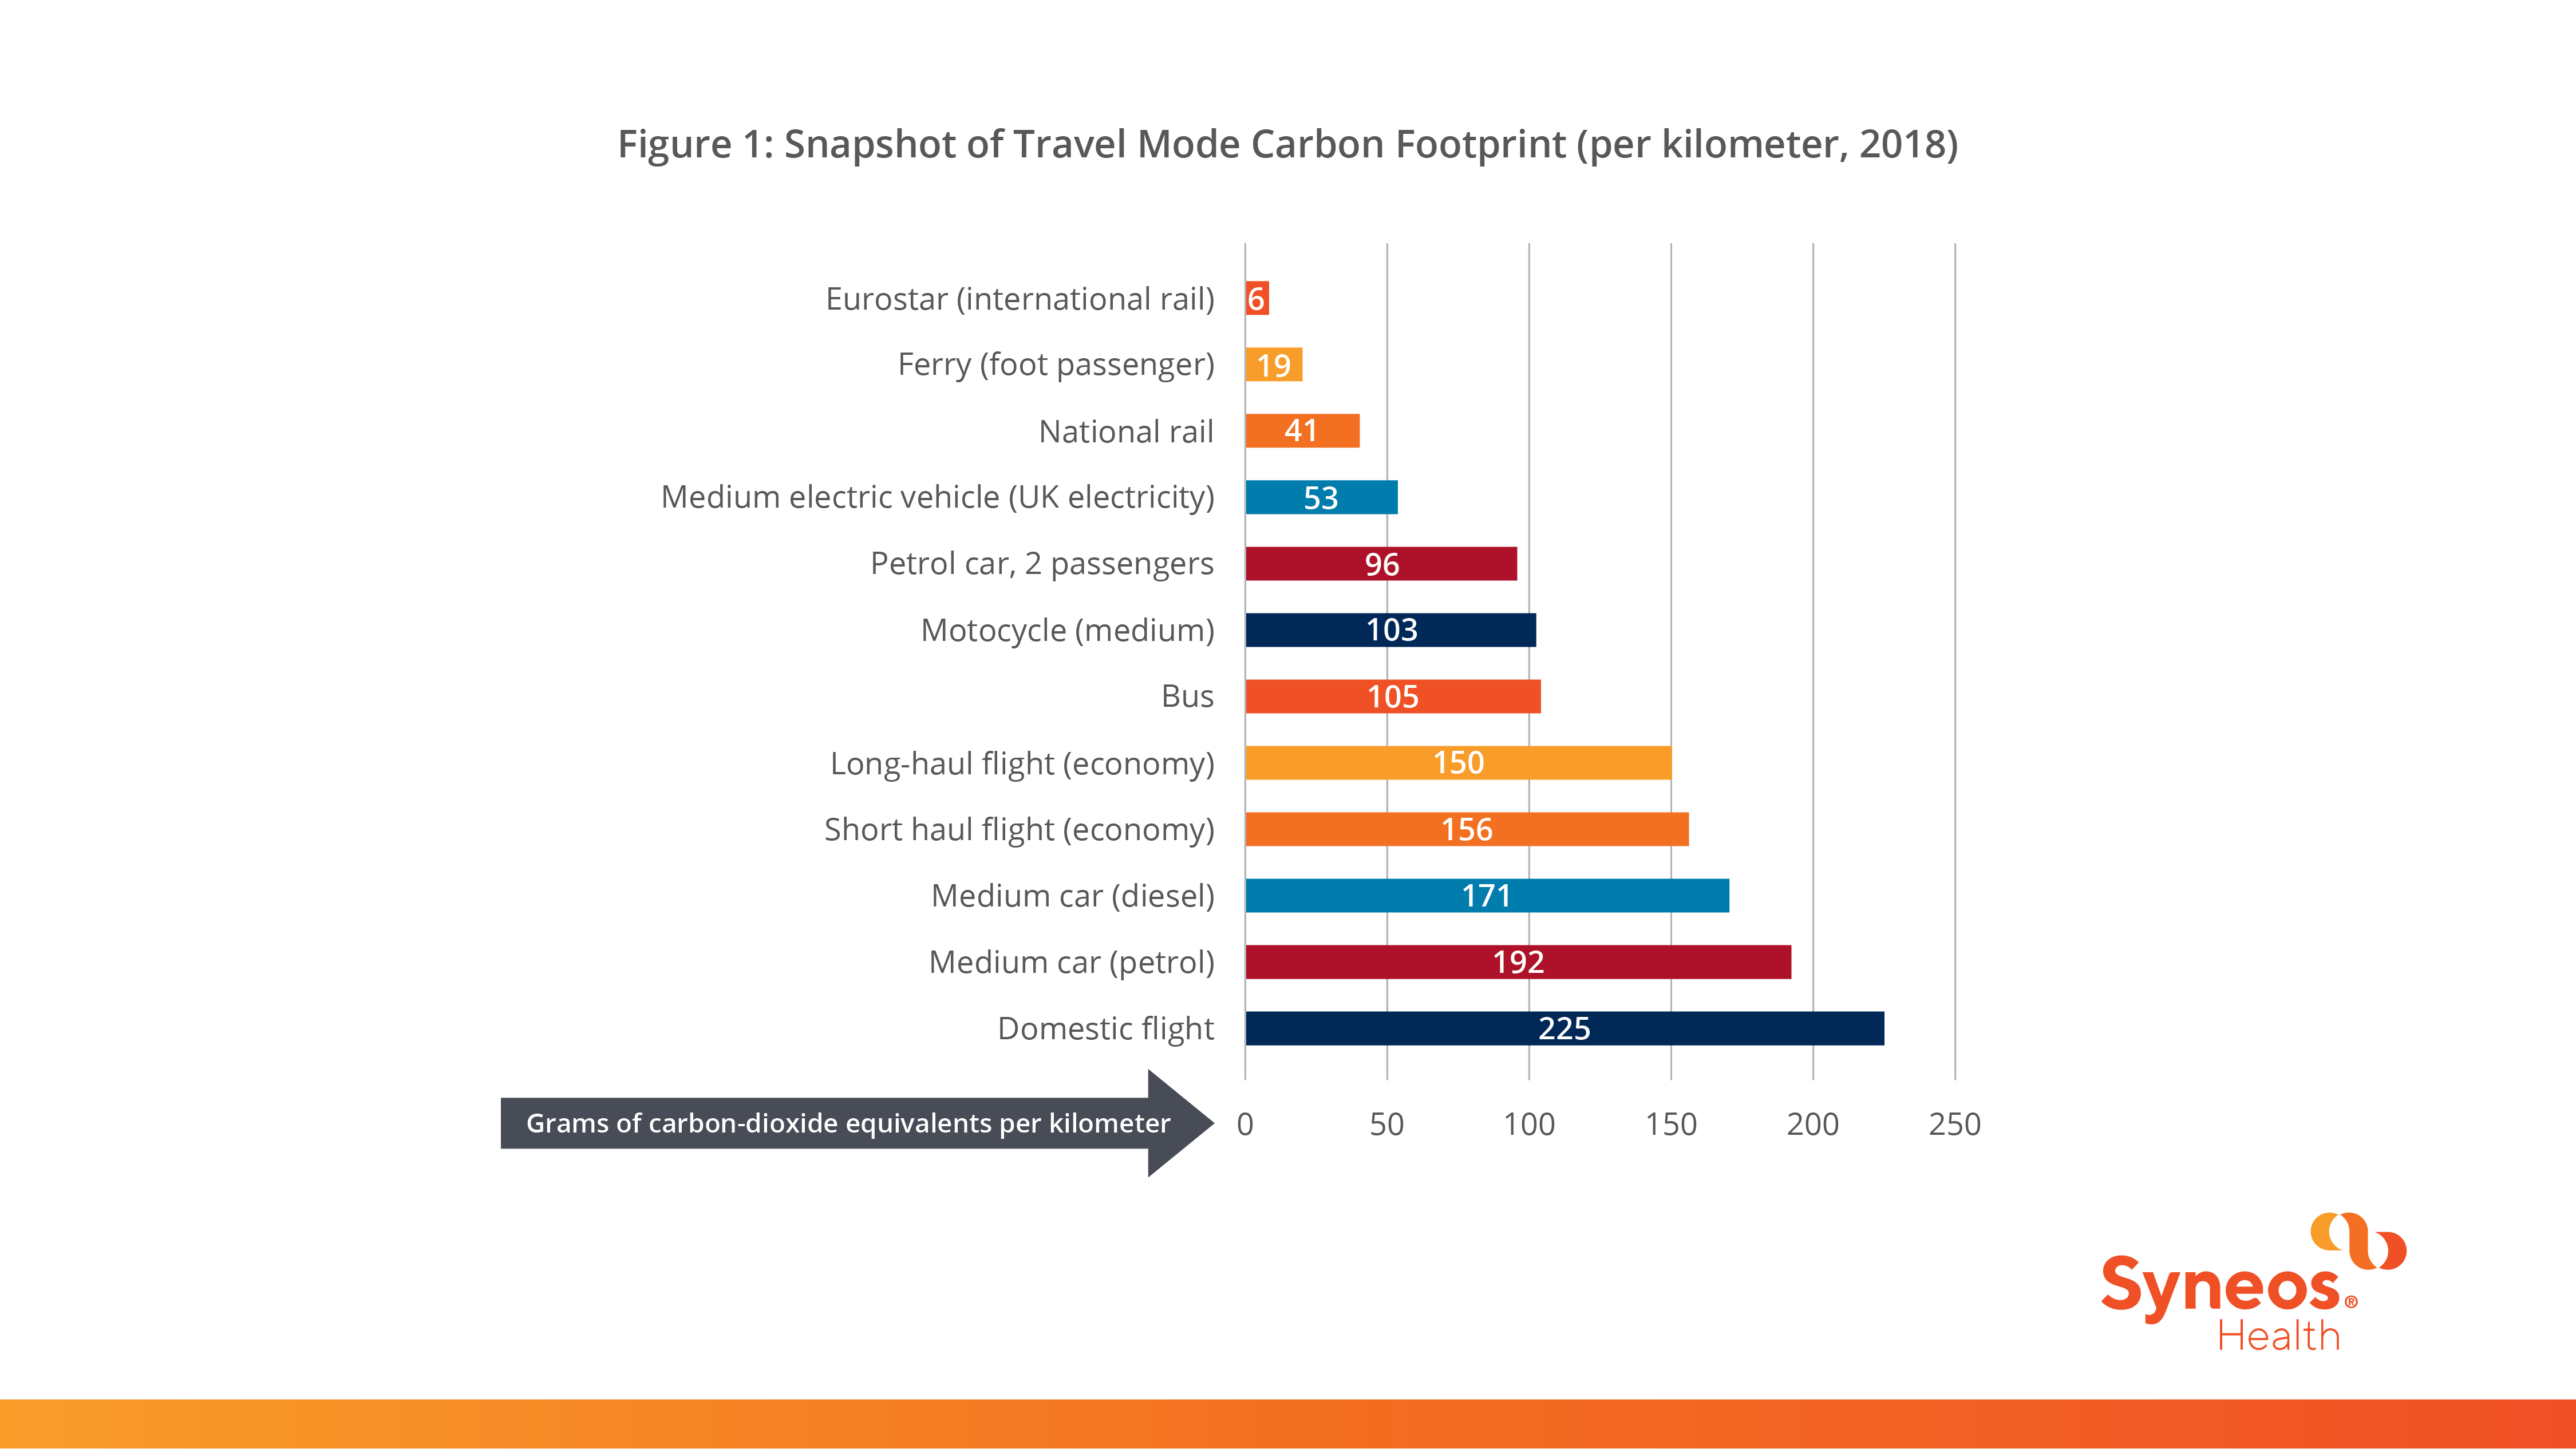
The carbon footprint of travel is measured in grams of carbon dioxide equivalents per passenger kilometer – a measure that includes the impact of increased warming from aviation emissions at altitude. The Syneos Health tool is built using data on carbon emission factors from the UK Department of Business, Energy, and Industrial Strategy, as shown in Figure 1.
Figure 1: Snapshot of Travel Mode Carbon Footprint (per kilometer, 2018)
The ICR presents dashboards and reports to help us understand our current carbon emissions baseline. The dashboards are customizable and can offer cumulative data. The data can be filtered by month and country and summarized for all CRAs or at the individual CRA level.
The displays include “Digital badges” or, quick indicators, showing:
- Total CO2 emission
- Total distance traveled
- # of countries traveled
- # of CRAs tracked
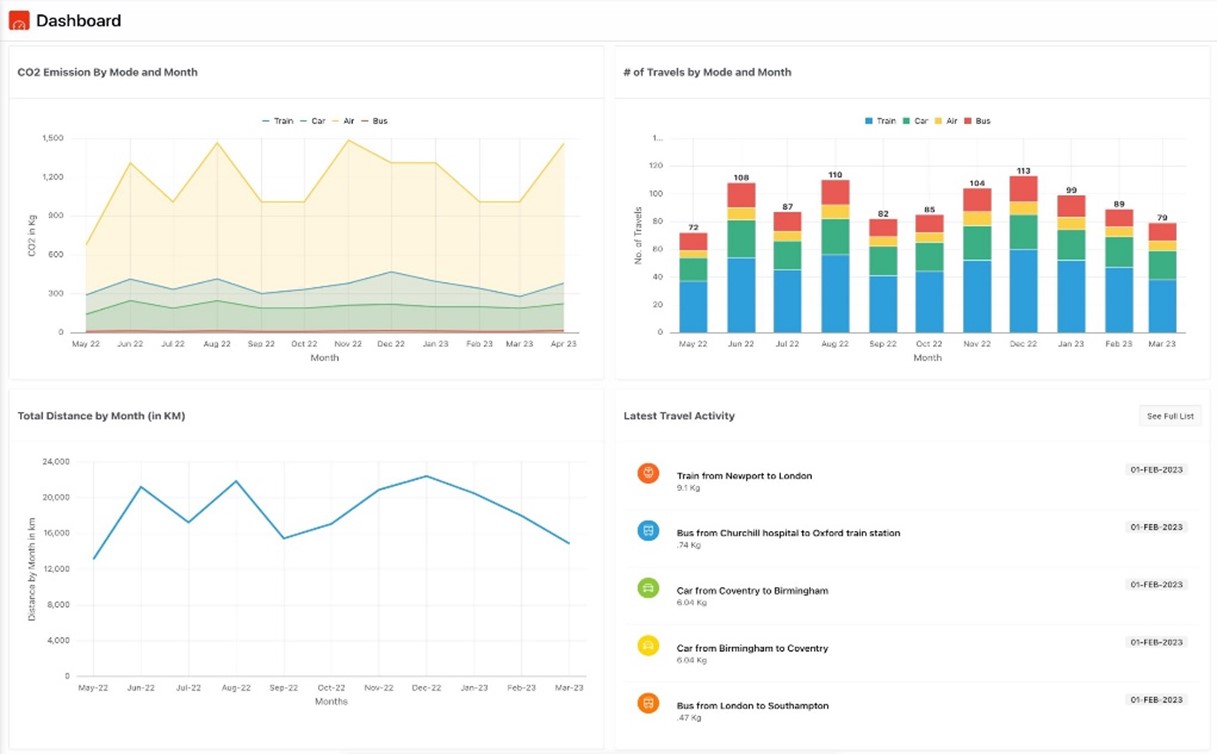
And the charts and graphs provide such details as shown in Figure 2:
- CO2 emissions by transportation mode
- CO2 emission indicator with goals
- CO2 emissions by month and transportation mode
- Total CO2 emissions – Actual vs Goal
- A Summary of CO2 emissions for the past 12 months by vehicle type
- An overview of total trips made for the past 12 months by vehicle type
- Distance travelled for the past 12 months
- Latest five trips conducted by the CRA
Figure 2: Sample ICR Tool Dashboards

Long-Term Syneos Health Carbon Reduction Initiatives
We aim to honor our commitment to The Climate Pledge to achieve net-zero annual carbon emissions by 2040 by measuring and reporting greenhouse emissions on a regular basis and by implementing decarbonization strategies. In particular, we will concentrate on reducing emissions from the two largest carbon producers of our business: corporate real estate and third-party supply chain activities.
Climate scientists have categorized emissions into three groups. Scope 1 emissions are those that an organization creates directly by running its facilities and vehicles. Scope 2 emissions are those generated indirectly on an organization’s behalf, such as from the energy it purchases. Scope 3 emissions are those produced up and down the value chain by vendors and customers. We have target goals for 2026 to reduce Scope 1 and Scope 2 emissions by 10 percent compared to the 2021 baseline and by five percent for Scope 1, 2 and 3. However, this year, we have both improved our reporting process and committed to science-based targets with the Science Based Targets initiative. As a result of both of these activities, we are re-evaluating our baseline year from which to set targets, and we are also in the process of assessing the SBTi criteria to set targets that are aligned to it, which may mean updating our current targets.
We’ve established a new Environmental, Social and Governance Committee to accelerate and oversee our ambitions and will continue to improve and submit our environmental data to the Carbon Disclosures Project (CDP), a not-for-profit charity that runs the global disclosure system to help organizations manage their environmental impact.
Conclusion
Syneos Health acknowledges our responsibility to help stem the negative effects of climate change and the inevitable consequences for human health. As a result, we’re executing against carefully planned goals for 2023 and look forward to the future of achieving net-zero annual carbon emissions by 2040. Through our pilot project to monitor carbon emissions generated by CRA travel, we hope to identify efficiencies that simultaneously serve sponsors and protect the planet. The data we gather from our proprietary ICR tool will inform our CRA resource planning and assignments, supporting innovative solutions.
Do you want to find answers to your company's needs in a way that not only address the issues unique to you but does so in a sustainable way? See what flexible and fit-for-purpose solutions FSP 360 can offer.
Contributors
Jennifer Anderson, Associate Director, Syneos Health Environmental, Social & Governance
Jeni Fan, Executive Director, FSP 360, Syneos Health
Simone Schäfer, Executive Director, Clinical Operations, FSP 360, Syneos Health
Jennifer Sozio, Senior Vice President, Clinical Operations, FSP 360
Aparna Srivastava, Vice President, Global Client Solutions, Syneos Health
Related Content

Looking for exclusive insight?